Biodiversity
Monitoring
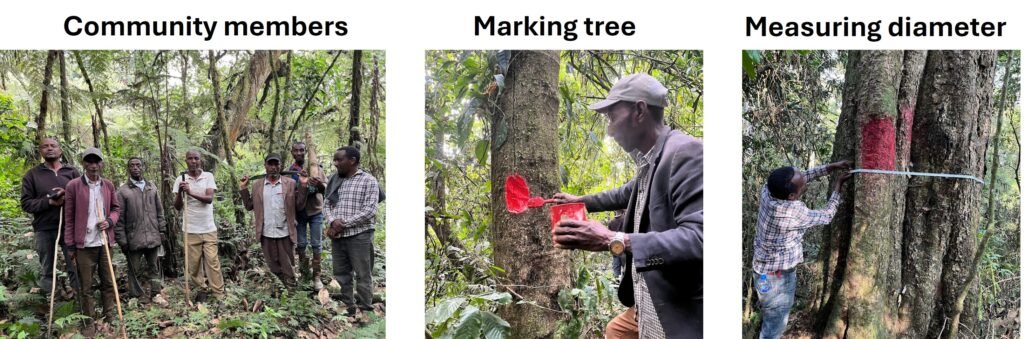
Rich biodiversity is evident from the two detailed surveys of woody species biodiversity that we have commissioned in these two districts, where wild coffee and forest-friendly honey are being gathered. These scientific surveys are further complemented by community biodiversity monitoring (CBM), in which local residents conduct regular assessments of the forest biodiversity. The baseline and endline surveys will provide information on how biodiversity is being conserved in these forests.
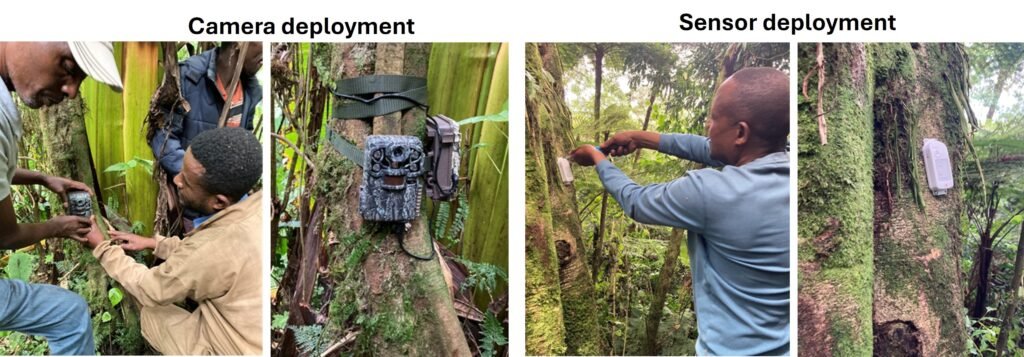
To complement the community-driven plant surveys, motion-sensitive wildlife cameras and microclimate sensors have been installed throughout the forests. These devices capture data on the local climate (temperature and humidity) and document a wide range of diverse, fascinating, and colourful wildlife, including Colobus and De Brazza monkeys, Blue and vervet monkeys, olive baboons, honey badgers, civet cats, genets, antelope, caracals, porcupines, bush pigs, and more.
Explore the interactive map to discover the locations of CBM biodiversity plots, as well as wildlife cameras and microclimate sensors.
Wildlife
Wildlife is being monitored within the forests of eight communities. In Sheko, these communities include Mezgisuriya, Bonki, Bardika/Jenjeka, and Usika. In Anderacha, the communities are Bonga, Yaga, and Buti. Below are selected videos and photos capturing wildlife in these communities.
Night-time videos and photos have captured a variety of wildlife, including olive baboons, birds, genets, civet cats, antelopes, hyenas, porcupines, bush mice, and bush pigs.
Daytime videos and photos capturing various wildlife, including caracals, civet cats, birds, olive baboons, Colobus and De Brazza monkeys, and antelope.
Microclimate
In the Sheko district, fourteen sensors measuring humidity and twenty-nine sensors measuring temperature were deployed. The top graphs show time-series data of temperature and humidity in natural (blue) and coffee (red) forests, while the bottom graphs illustrate the relationships between elevation and temperature, and elevation and humidity.

In the Anderacha district, ten sensors measuring humidity and thirteen sensors measuring temperature were deployed. The top graphs display time-series data of temperature and humidity in inside (blue) and fringe (red) forests, while the bottom graphs depict the relationships between elevation and both temperature and humidity.
